Summary: Speed#
This file provides a concise summary of the speed benchmarks provided previously.
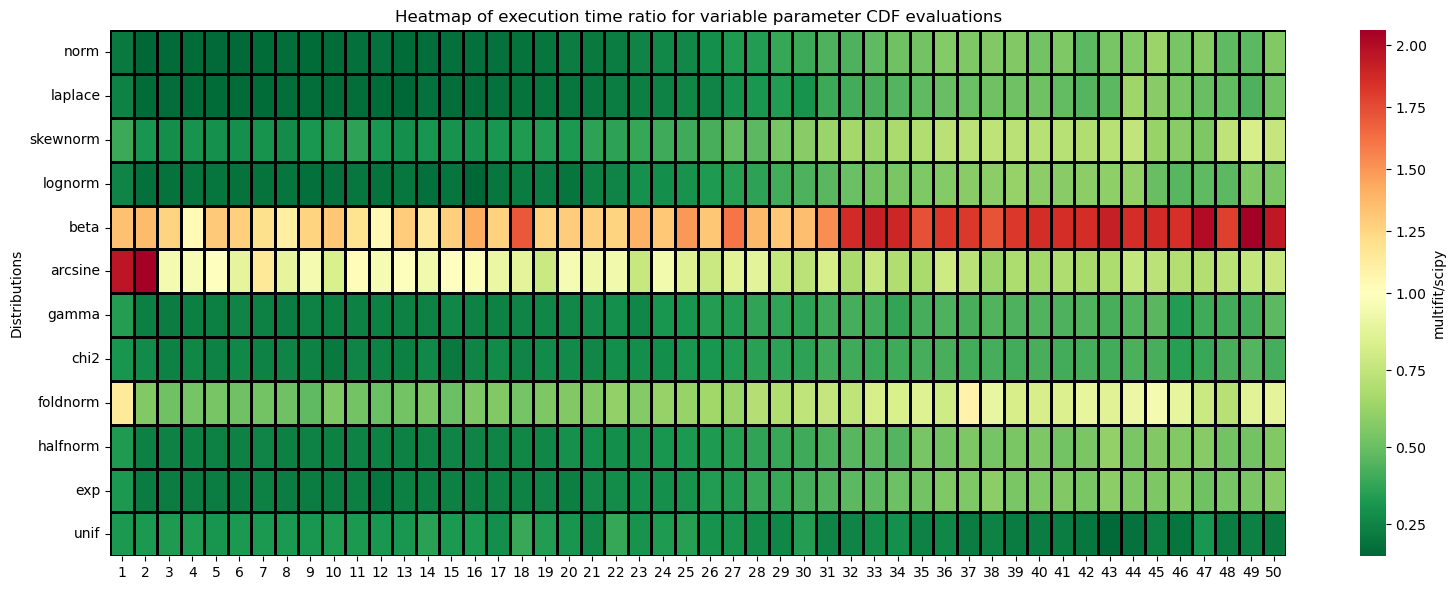
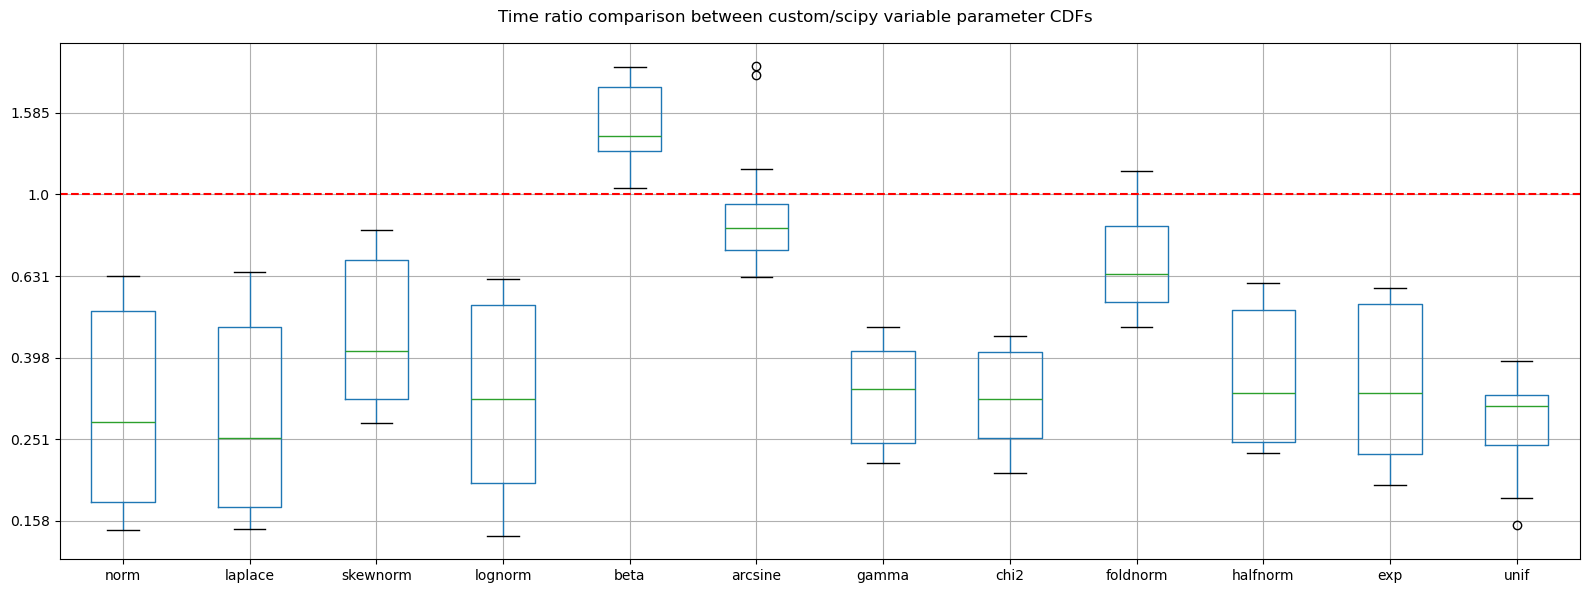
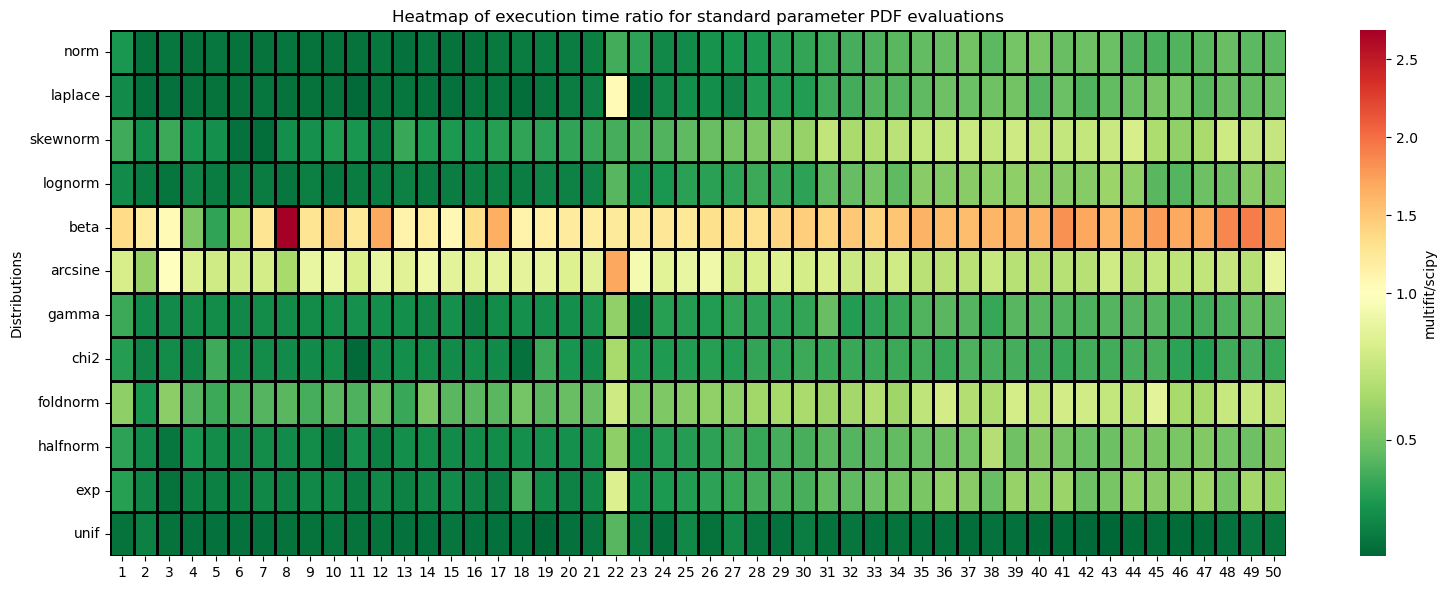
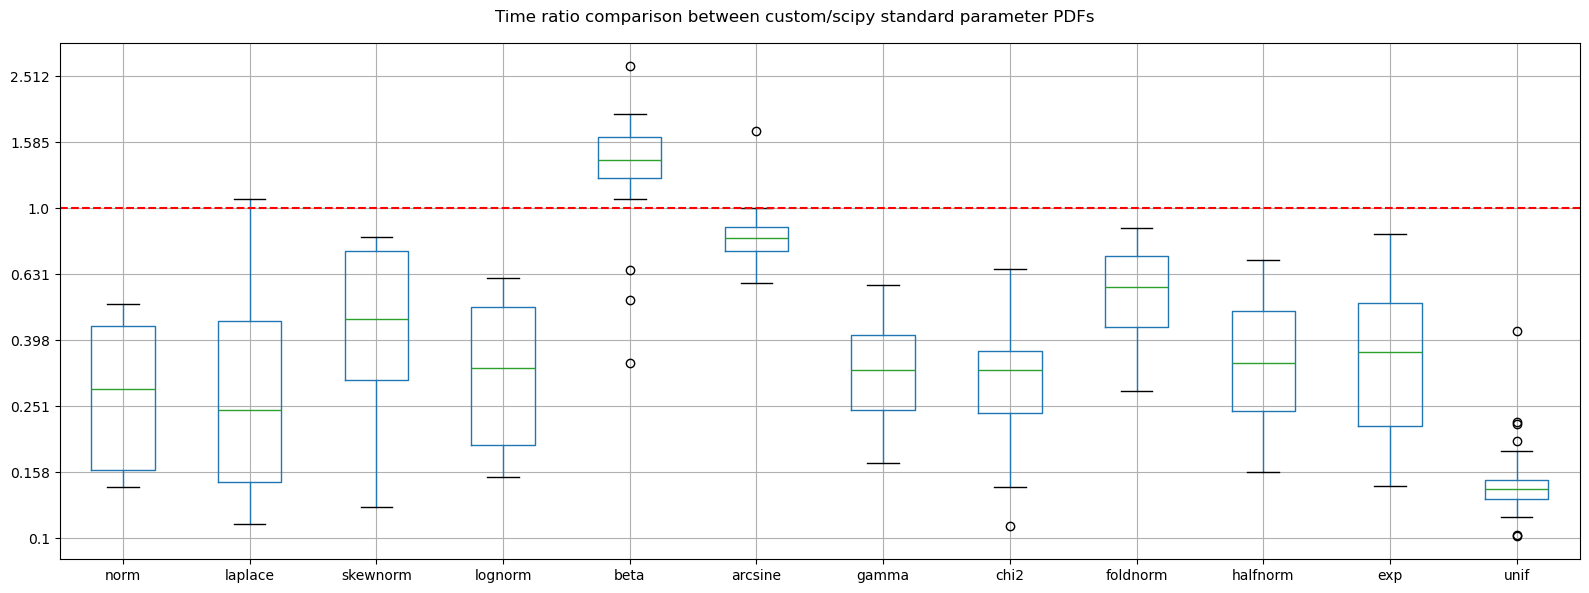
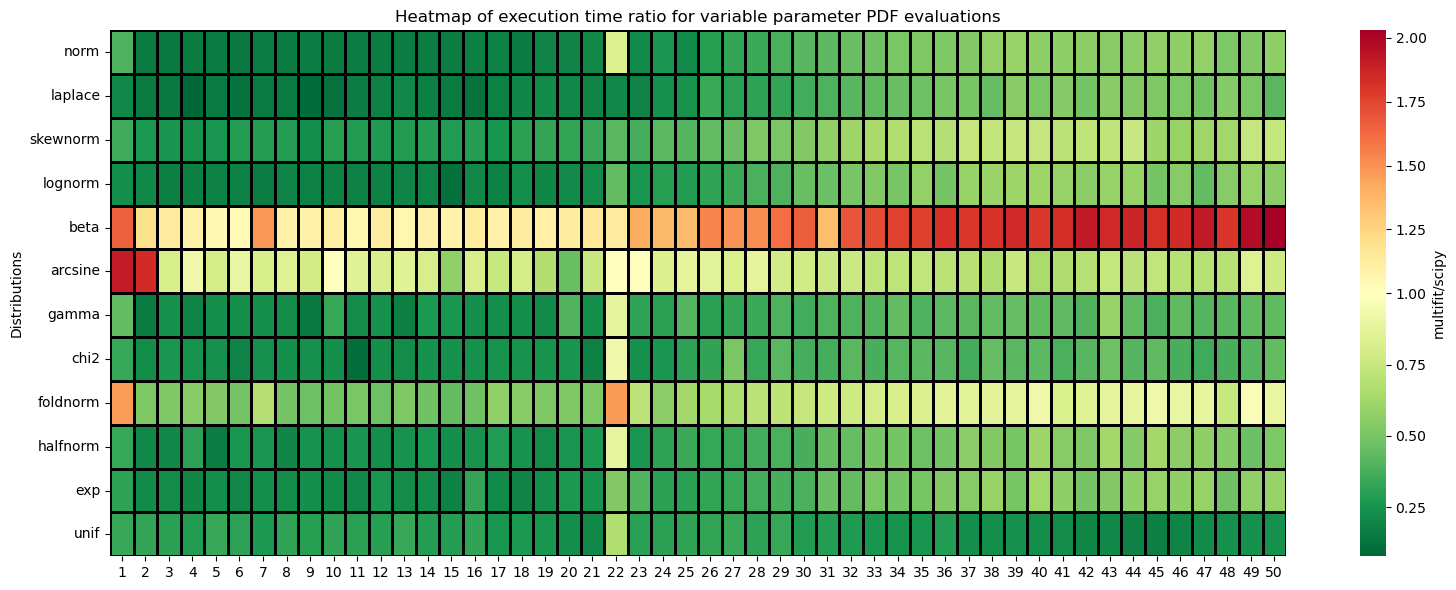
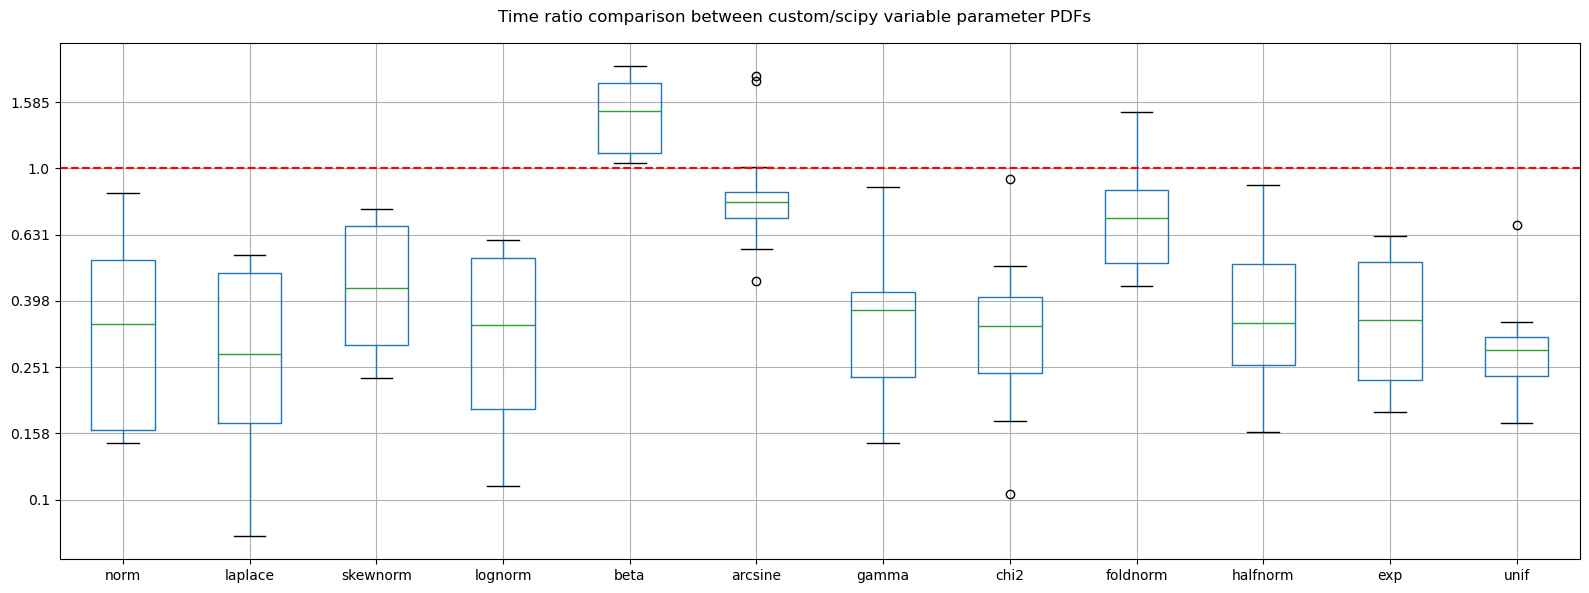
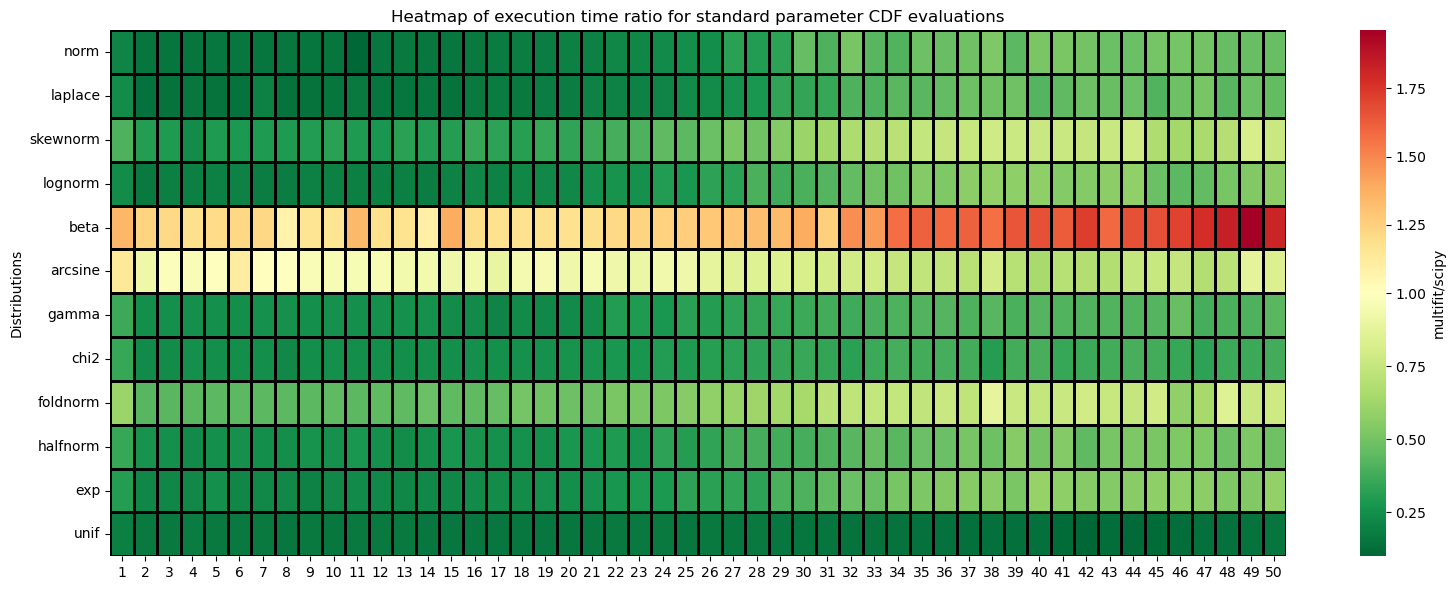
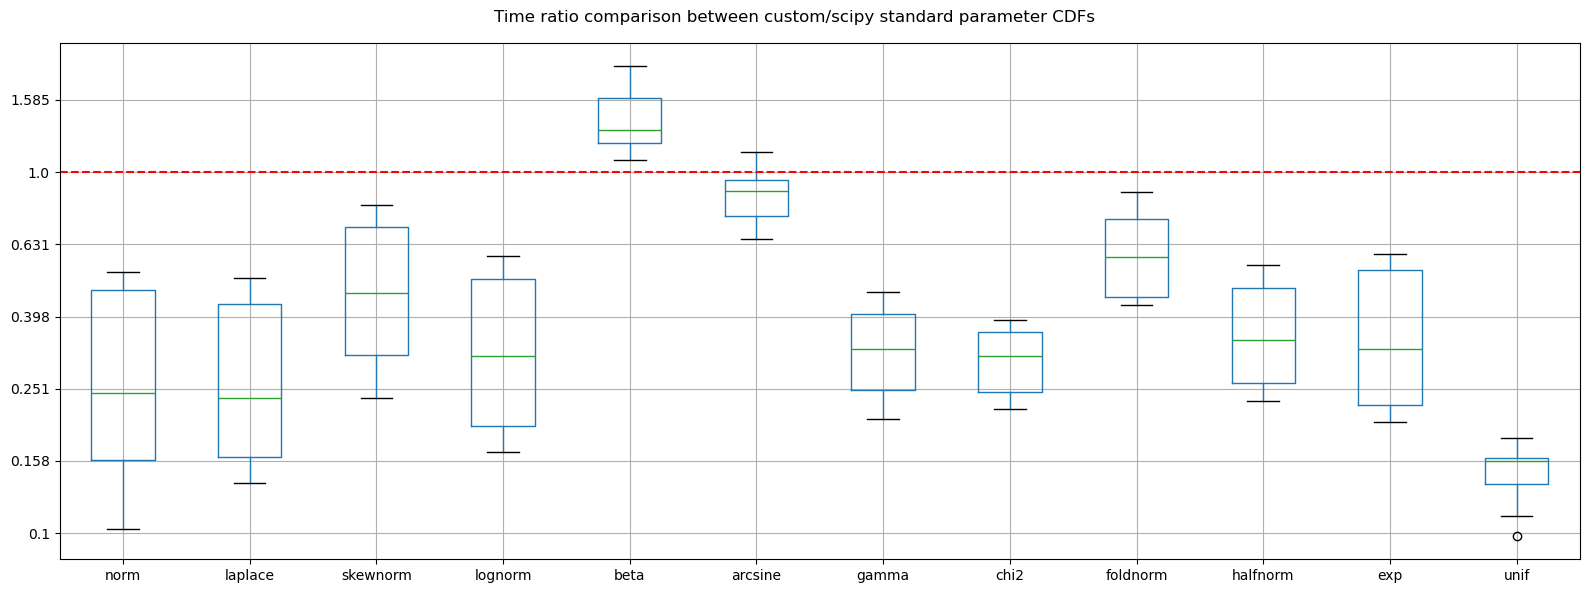
Fifty tests were performed with varying number of x-values in the x-array to be evaluated.
In the majority of test cases, the
pymultifitimplementation performs faster thenscipy.However,
betaconsistently show performance parity withscipy. Notable performance degradations are observed in these distributions.Other distributions, such as
arcsine, andfoldnormexhibit some variability, with occasional high computation time frompymultifit.
Overall, the benchmarks suggest that pymultifit implementations generally offers better performance over large values of x-array sizes. These comparisons are made using scalar (float) parameters only. The custom distributions do not yet support broadcasting over array-valued parameters (e.g., mu, sigma, etc.) like SciPy’s implementations do.
[1]:
import numpy as np
import pandas as pd

from functions import boxplot_comparison, heatmap
All the PDF/CDF functions were applied on the following number of points in x-arrays
[2]:
n_points_list = np.logspace(0.3, 6, num=50, dtype=int)

print(n_points_list)
[      1       2       3       4       5       7       9      13      17
      22      29      37      49      64      84     110     144     189
     247     323     423     553     723     945    1235    1614    2111
    2759    3606    4714    6163    8056   10530   13764   17992   23519
   30743   40186   52530   68664   89755  117324  153360  200466  262039
  342526  447734  585257  765021 1000000]
PDF comparison#
[3]:
m_df1 = pd.read_csv('./PDF_multifit_df.csv')
s_df1 = pd.read_csv('./PDF_scipy_df.csv')

m_df2 = pd.read_csv('./PDF_multifit_variable_df.csv')
s_df2 = pd.read_csv('./PDF_scipy_variable_df.csv')
[4]:
heatmap(m_df1, s_df1, 'standard parameter PDF')
boxplot_comparison(m_df1, s_df1, 'standard parameter PDFs')
[5]:
heatmap(m_df2, s_df2, 'variable parameter PDF')
boxplot_comparison(m_df2, s_df2, 'variable parameter PDFs')
CDF comparison#
[6]:
m_df1 = pd.read_csv('./CDF_multifit_df.csv')
s_df1 = pd.read_csv('./CDF_scipy_df.csv')

m_df2 = pd.read_csv('./CDF_multifit_variable_df.csv')
s_df2 = pd.read_csv('./CDF_scipy_variable_df.csv')
[7]:
heatmap(m_df1, s_df1, 'standard parameter CDF')
boxplot_comparison(m_df1, s_df1, 'standard parameter CDFs')
[8]:
heatmap(m_df2, s_df2, 'variable parameter CDF')
boxplot_comparison(m_df2, s_df2, 'variable parameter CDFs')